
High domestic inflation. Volatile currencies. Foreign languages. Domestic insider advantages. Different cultural, legal and governance practices. Unpredictable politics. These are just some of the risks investors must contemplate when considering an investment in frontier markets. So why bother? Rory Kutisker-Jacobson discusses the long-term investment case for these markets.
Returns over the past decade from many smaller emerging and frontier markets, including South Africa, have been poor, as shown in Table 1. For the 10 years to December 2024, the MSCI Frontier Emerging Markets Index (MXFEM Index), which tracks a basket of companies in many of these countries, has returned a paltry 0.5% per annum (p.a.) in US dollars. Returns from most individual countries have been similar. By way of example, the MSCI indices for Vietnam and the Philippines, which track the largest companies in these markets, have delivered returns of 0.8% and -2.0% p.a. respectively over the last decade.
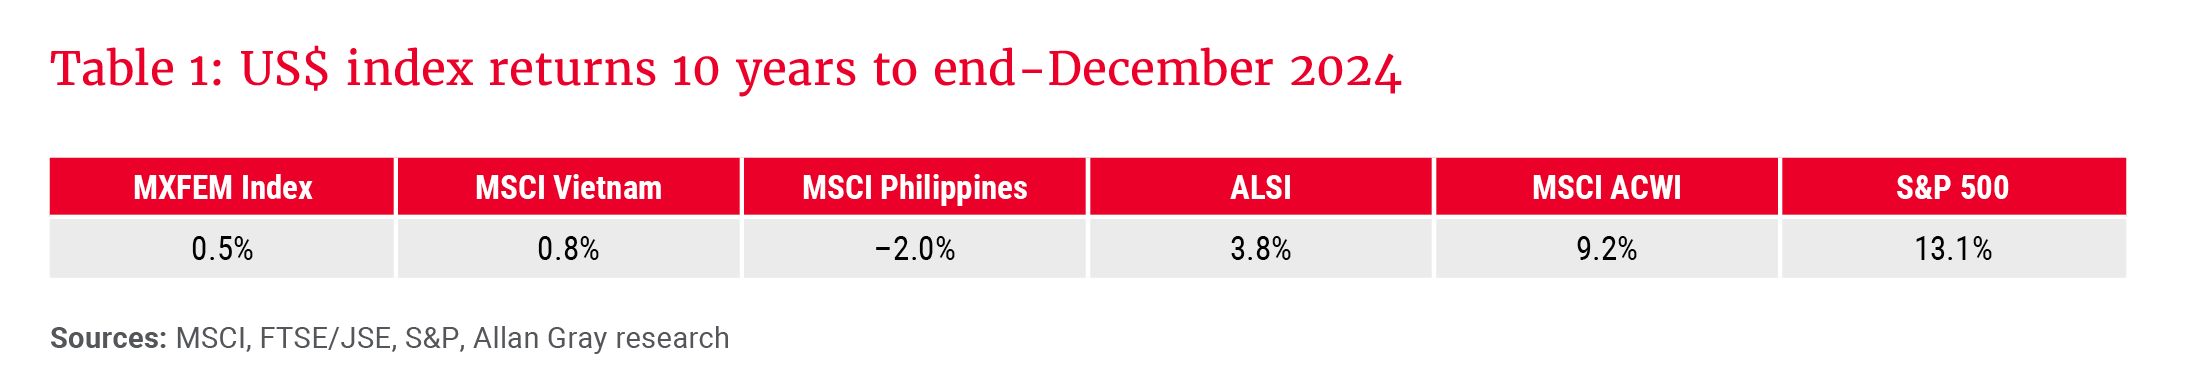
The FTSE/JSE All Share Index (ALSI), converted into US dollars, delivered a slightly better 3.8% p.a. return. In contrast, the MSCI All Country World Index (MSCI ACWI) has returned 9.2% p.a. over this same period, and the darling of the last decade, the US, has done even better, with the S&P 500 returning 13.1% p.a.
After reading the above laundry list of potential risks and considering past returns, if your immediate thought is “no thank you”, you are not alone. These risks may seem big, scary and unfamiliar, and the returns hardly seem salivating. All too many investors take a quick glance at frontier markets before swiftly moving along, deeming them too risky, too complex or, dare I say it, un-investable.
And therein lies the opportunity.
Balancing risk and opportunity
The reality is that every investment comes with risk. One cannot avoid risk. If you seek to avoid risk entirely and invest only in “risk-free” assets, you take on the risk that future returns may be insufficient to offset inflation or other liabilities you may need to meet over time.
If you invest by looking in the rear-view mirror, i.e. only in the best-performing and most popular companies, you risk overpaying, with a very rosy future already discounted in today’s price. There is no guarantee that the next 10 years will look like the previous 10.
While one cannot avoid risk, one can look for opportunities where the market has mispriced risk. Such situations, where the market has mispriced assets, are commonly referred to as market inefficiencies. The greater the number of market inefficiencies, the greater the opportunity for outsized returns for the active investor.
Oaktree Capital’s Howard Marks famously said that market inefficiency comes from two things: ignorance and prejudice. We believe that these two things are abundant in smaller emerging and frontier markets at this point in time. Ignorance, because there are not many global investors actively looking at frontier markets, and prejudice, because past returns at an aggregate level have been poor. It is human nature to look at that with which we are unfamiliar with greater scrutiny and disdain.
Graph 1 shows the weighting given to four large buckets in the MSCI ACWI. The first bucket, which accounts for just under 90% of the index’s weighting, is that of developed markets. Combined, these countries have a population of just under one billion, or roughly 12% of the world’s population. The US alone makes up more than 60% of the weighting in the index.
The second bucket reflects the five largest emerging markets by market capitalisation, being China, India, Brazil, South Korea and Taiwan. They contribute 9% to the weighting of the index, but roughly 38% to the world’s population (3.14 billion people).
The third bucket reflects all the smaller emerging markets and frontier markets that have some weighting in the MSCI ACWI. Despite having a combined population of just over two billion people (26% of the global total), their contribution to the index is just 2%.
The final bucket reflects all the countries that are not even represented in the MSCI ACWI, with a combined population of another two billion.
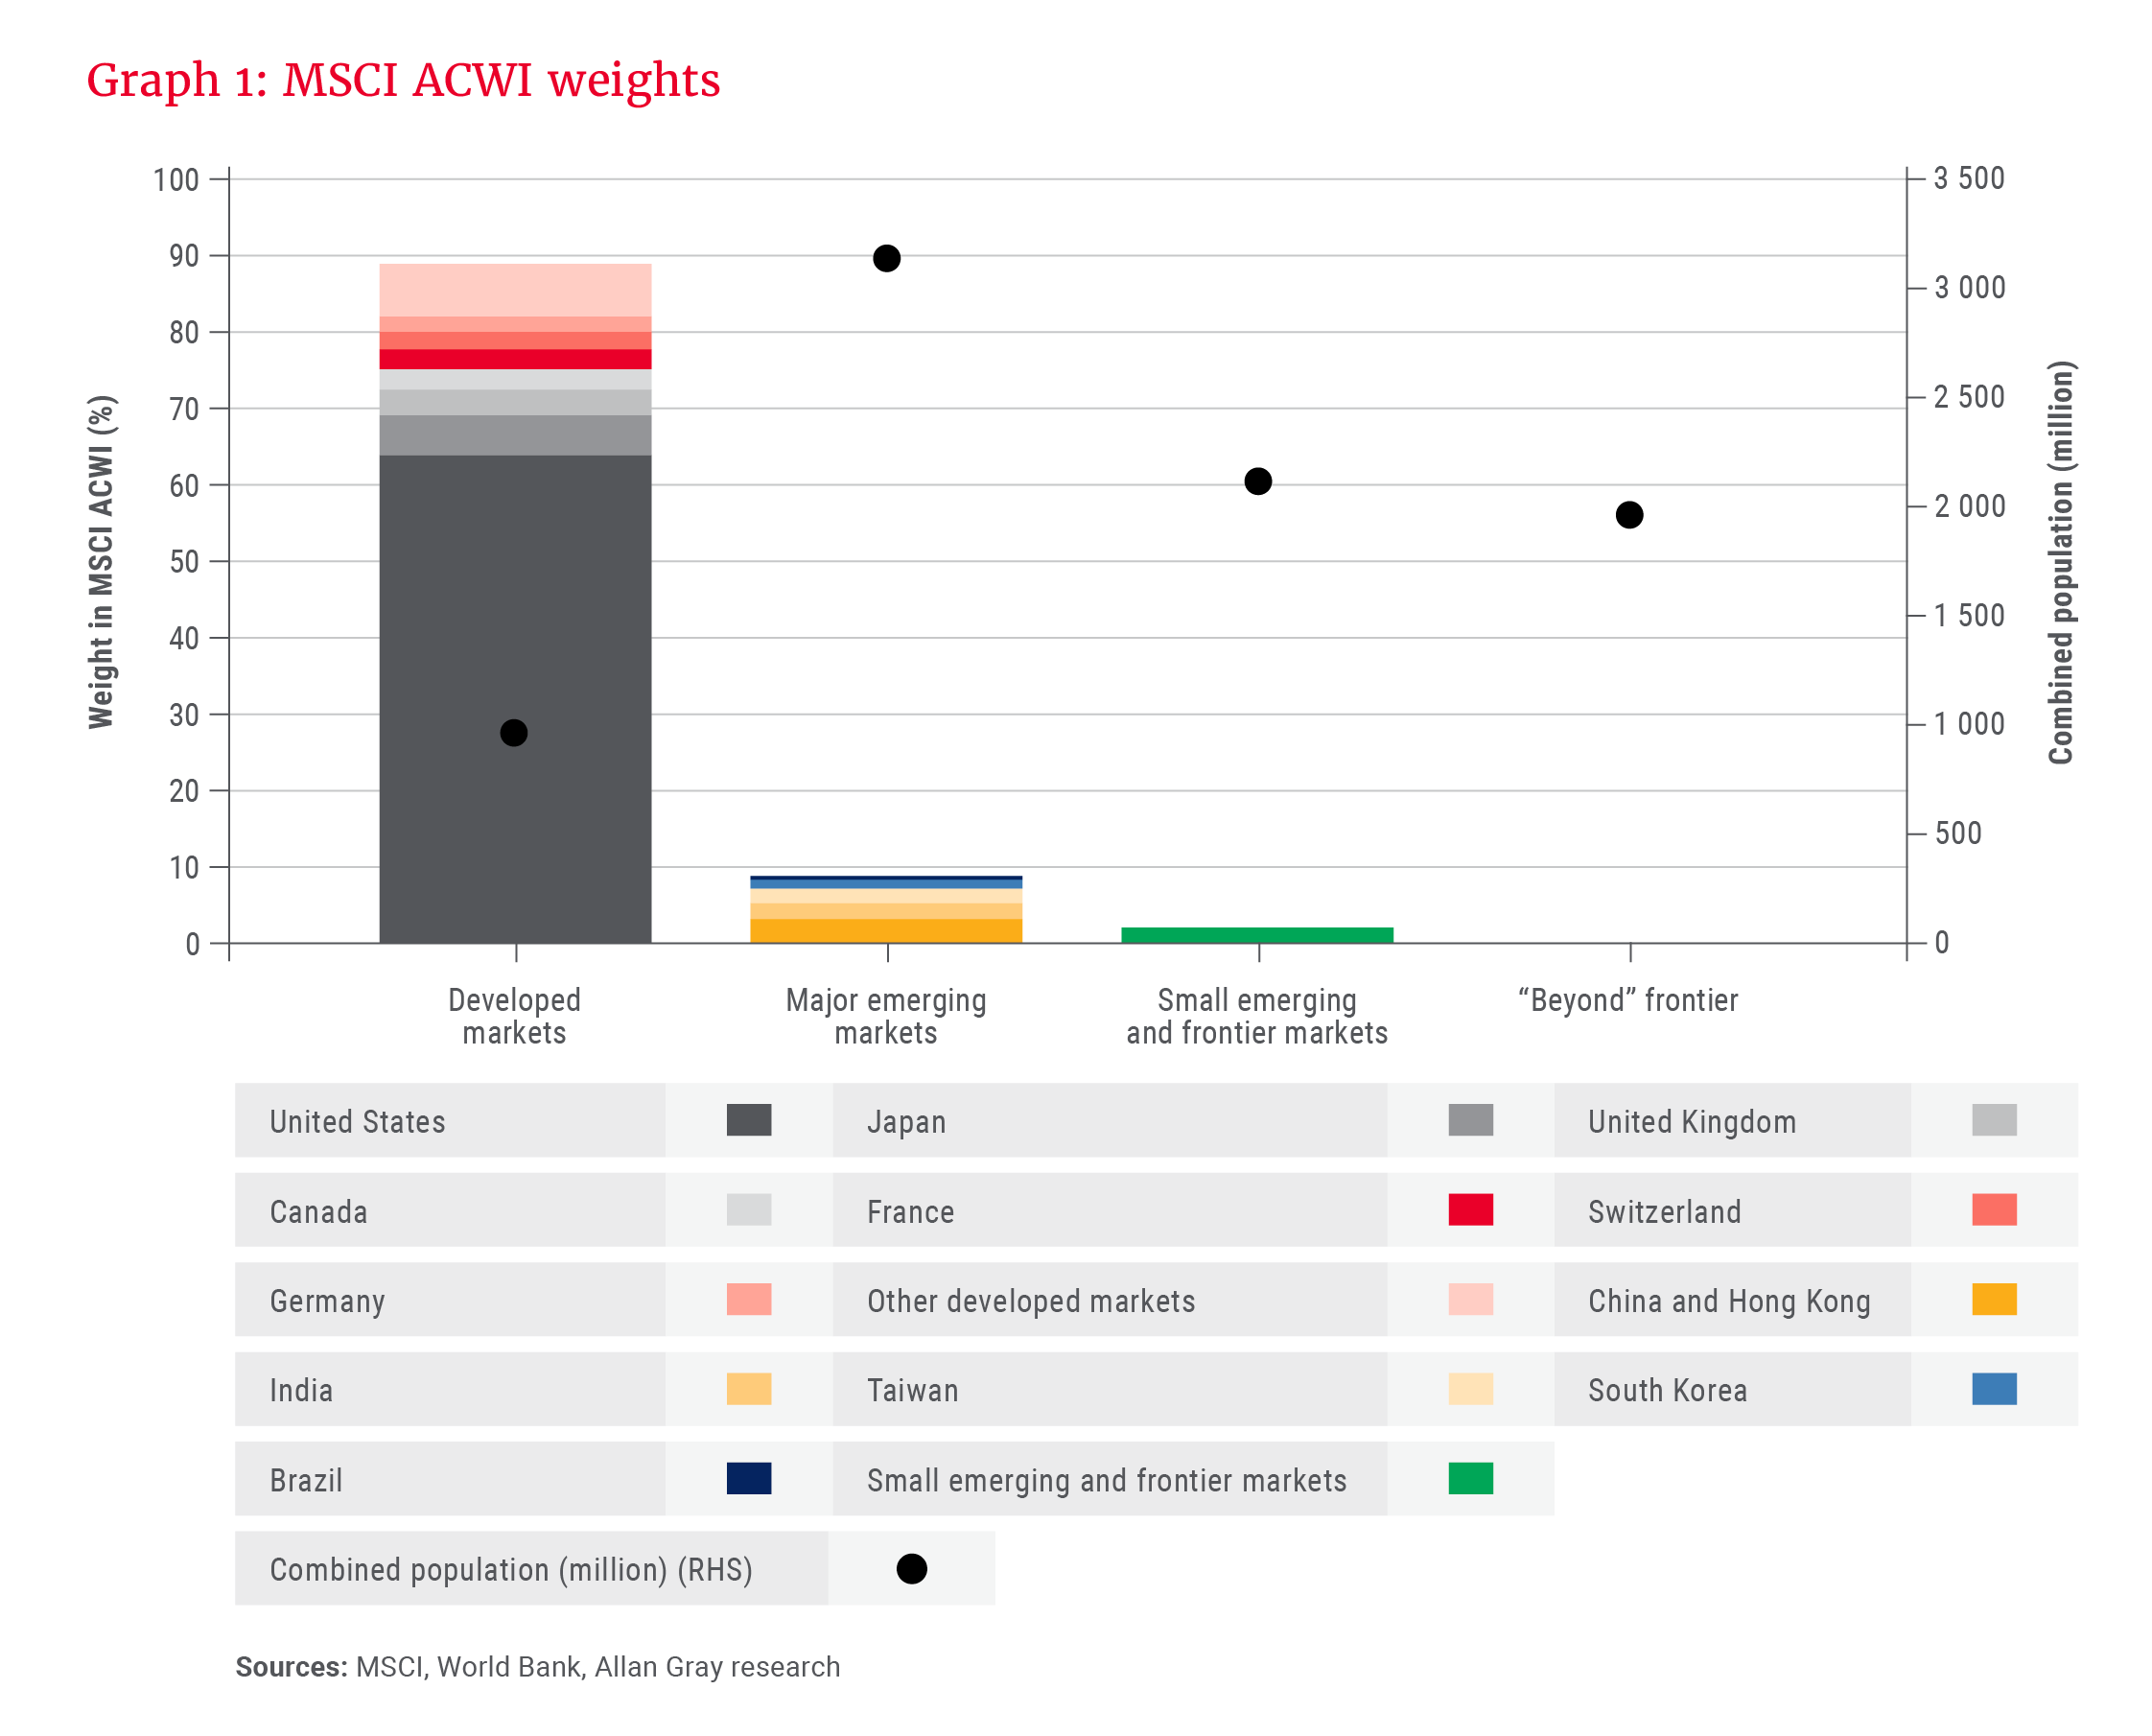
Put another way, roughly 90% of the world’s investors’ focus is on just 12% of the world’s population, while roughly 2% of their focus is on countries that account for 50% of the world’s population (the last two buckets combined). Admittedly, this is a little simplistic in nature, as most of the large companies in the index are multinational companies whose product reach stretches across the world, servicing a substantial portion of the global population. However, US tech giants Apple, Nvidia, Microsoft and Amazon each have a greater weight in the index than all these smaller emerging and frontier markets combined.
… such an environment should offer greater opportunities to find mispriced assets.
This serves to highlight the disparity in focus and attention. There are hundreds, if not thousands of high-calibre, smart people analysing each of the largest companies in the world in extreme detail, with substantial resources behind them. There are far fewer eyes looking for opportunities in frontier markets, and there is far less capital.
For the active investor willing to do the work and put in the research effort, such an environment should offer greater opportunities to find mispriced assets.
Banking on returns
Let us look at the banking sector as an example.
Capitec has been one of the darlings of the JSE for much of the past decade, providing a total return in rand of 58% over the past year, 19% p.a. over the past five years and 27% p.a. over the past 10 years.
But it is not just the share price that has done well – the underlying company performance has been excellent too. Since August 2013, Capitec has grown earnings by 18.5% p.a. in rand, for cumulative growth of over 540%. In US dollars, those figures are less stellar given rand weakness, but still impressive overall. Since August 2013, in US dollars, earnings have grown a cumulative 219% (or 11.1% p.a.). This is materially better than the largest bank on the JSE, FirstRand, which has compounded earnings since June 2013 at 8.6% p.a. in rand, but only 1.5% p.a. when translated into US dollars. That equates to cumulative growth of just 18% in US dollars.
In the US, J.P. Morgan is the largest bank. Since June 2013, J.P. Morgan has grown earnings at 10.5% p.a., for cumulative growth of 200% over the period.
Thus, while Capitec’s underlying performance has been stellar within South Africa, on a global basis, it has been good – but only marginally better than the largest US bank, once translated into US dollars.
Let’s now compare that performance with two frontier banks, both of which are currently held in the Allan Gray Frontier Markets Equity Fund: Halyk Bank, the largest bank in Kazakhstan, with an estimated 32% share of the loan market, and TBC Bank, the largest bank in Georgia, with an estimated 39% share of the loan market.
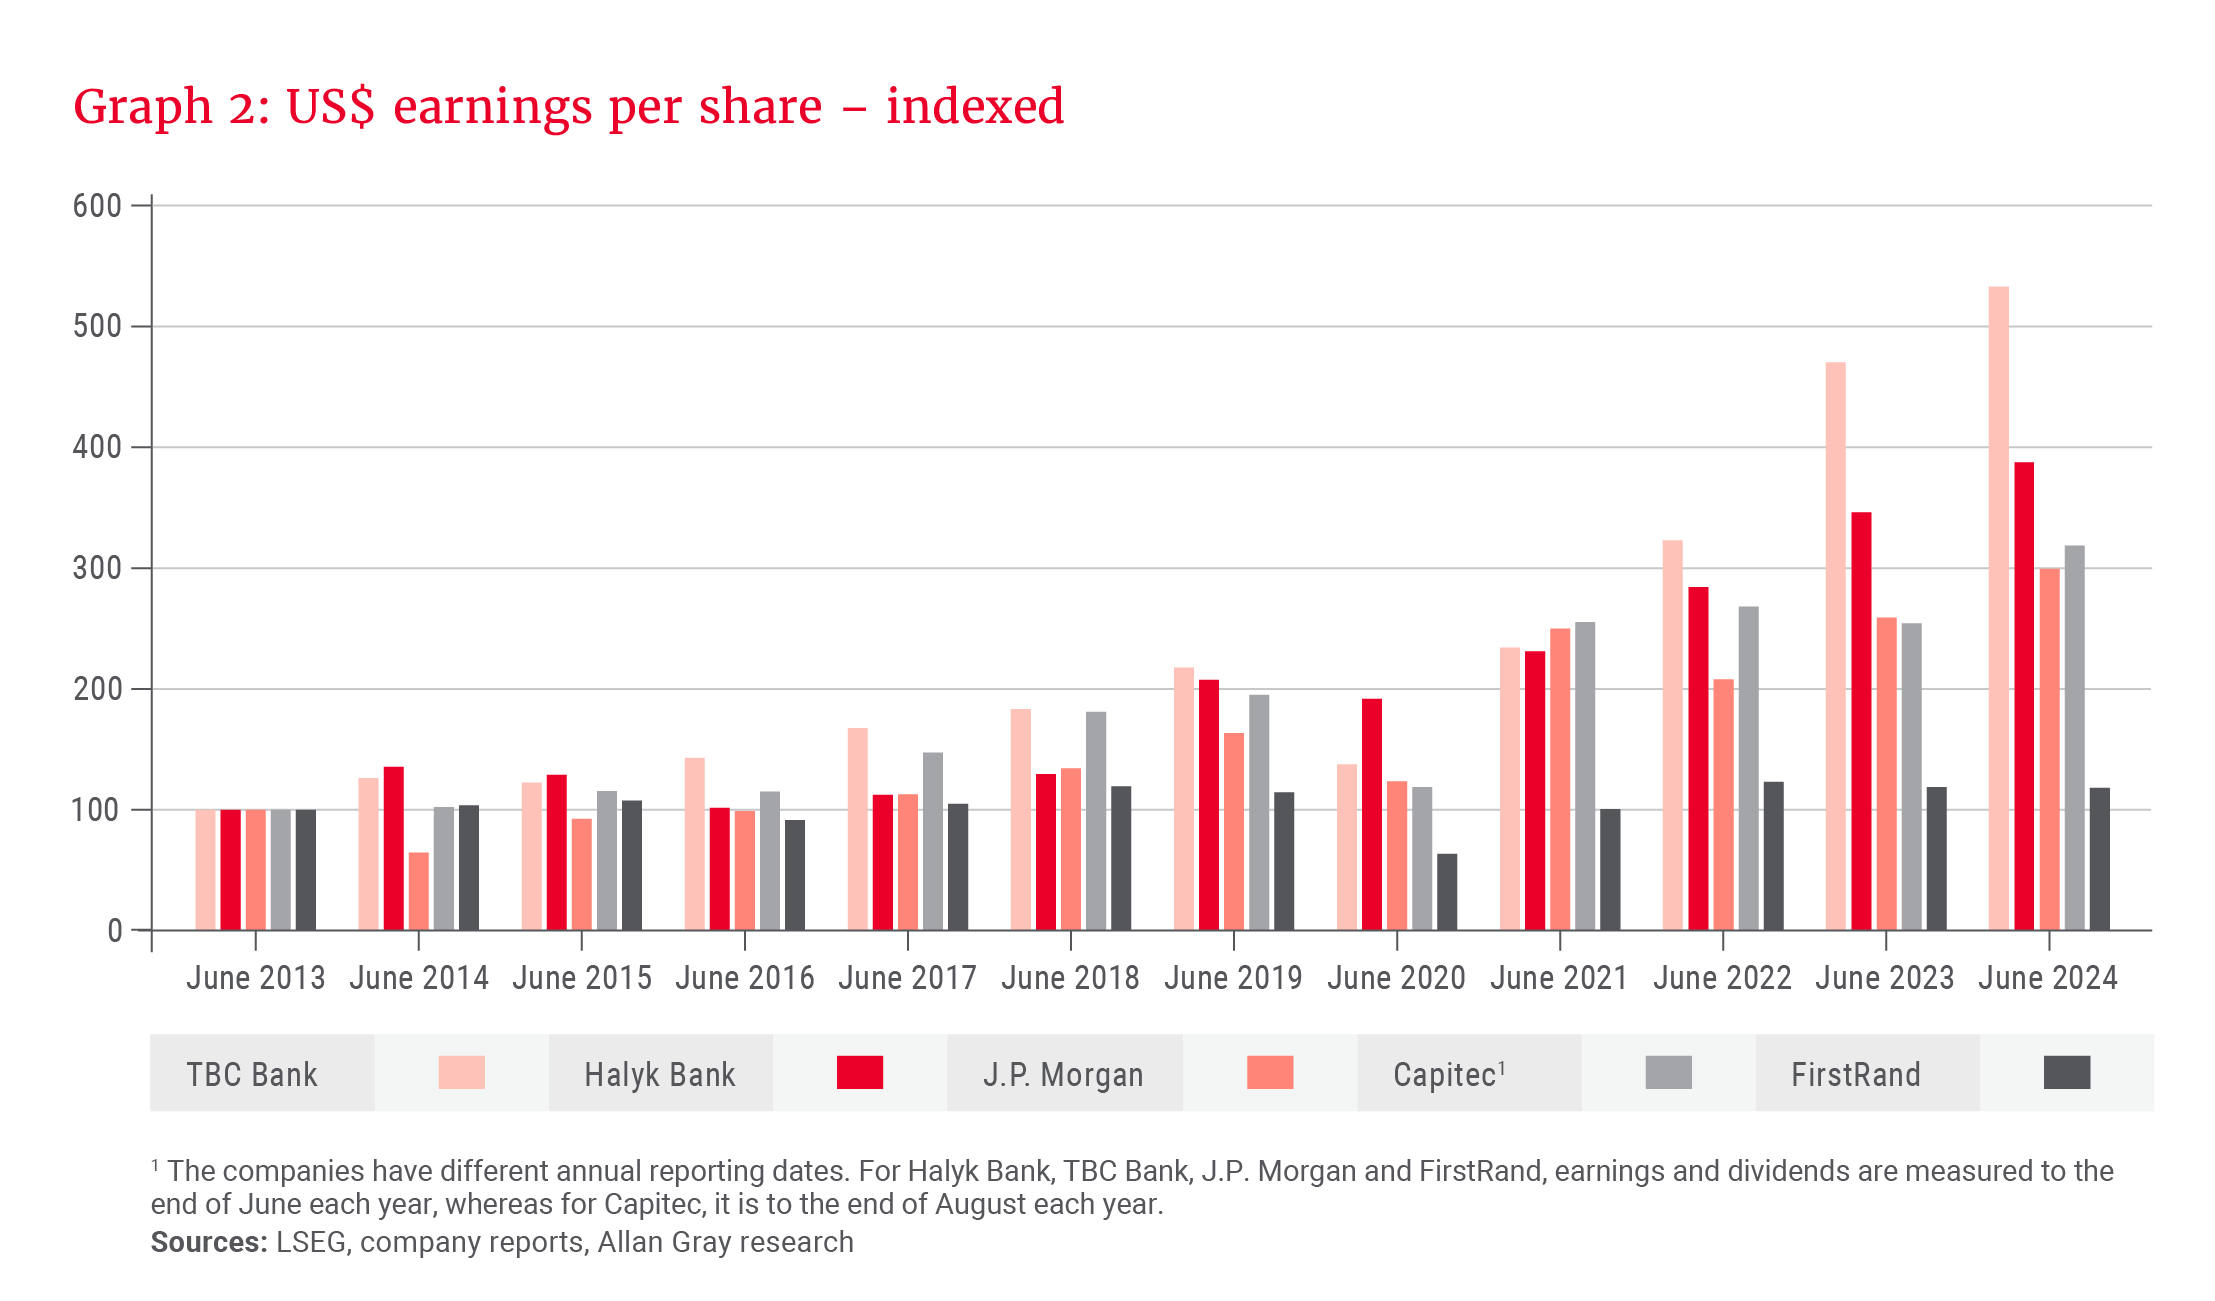
Since June 2013, Halyk has grown earnings by 13.1% p.a. in US dollars, for cumulative growth of 289%, while TBC has been even more impressive, with annual growth of 16.5%, for cumulative growth of 435%.
Graph 2 shows the trajectory of earnings for each of the mentioned banks in US dollars over this period, indexed to 100 at the start.
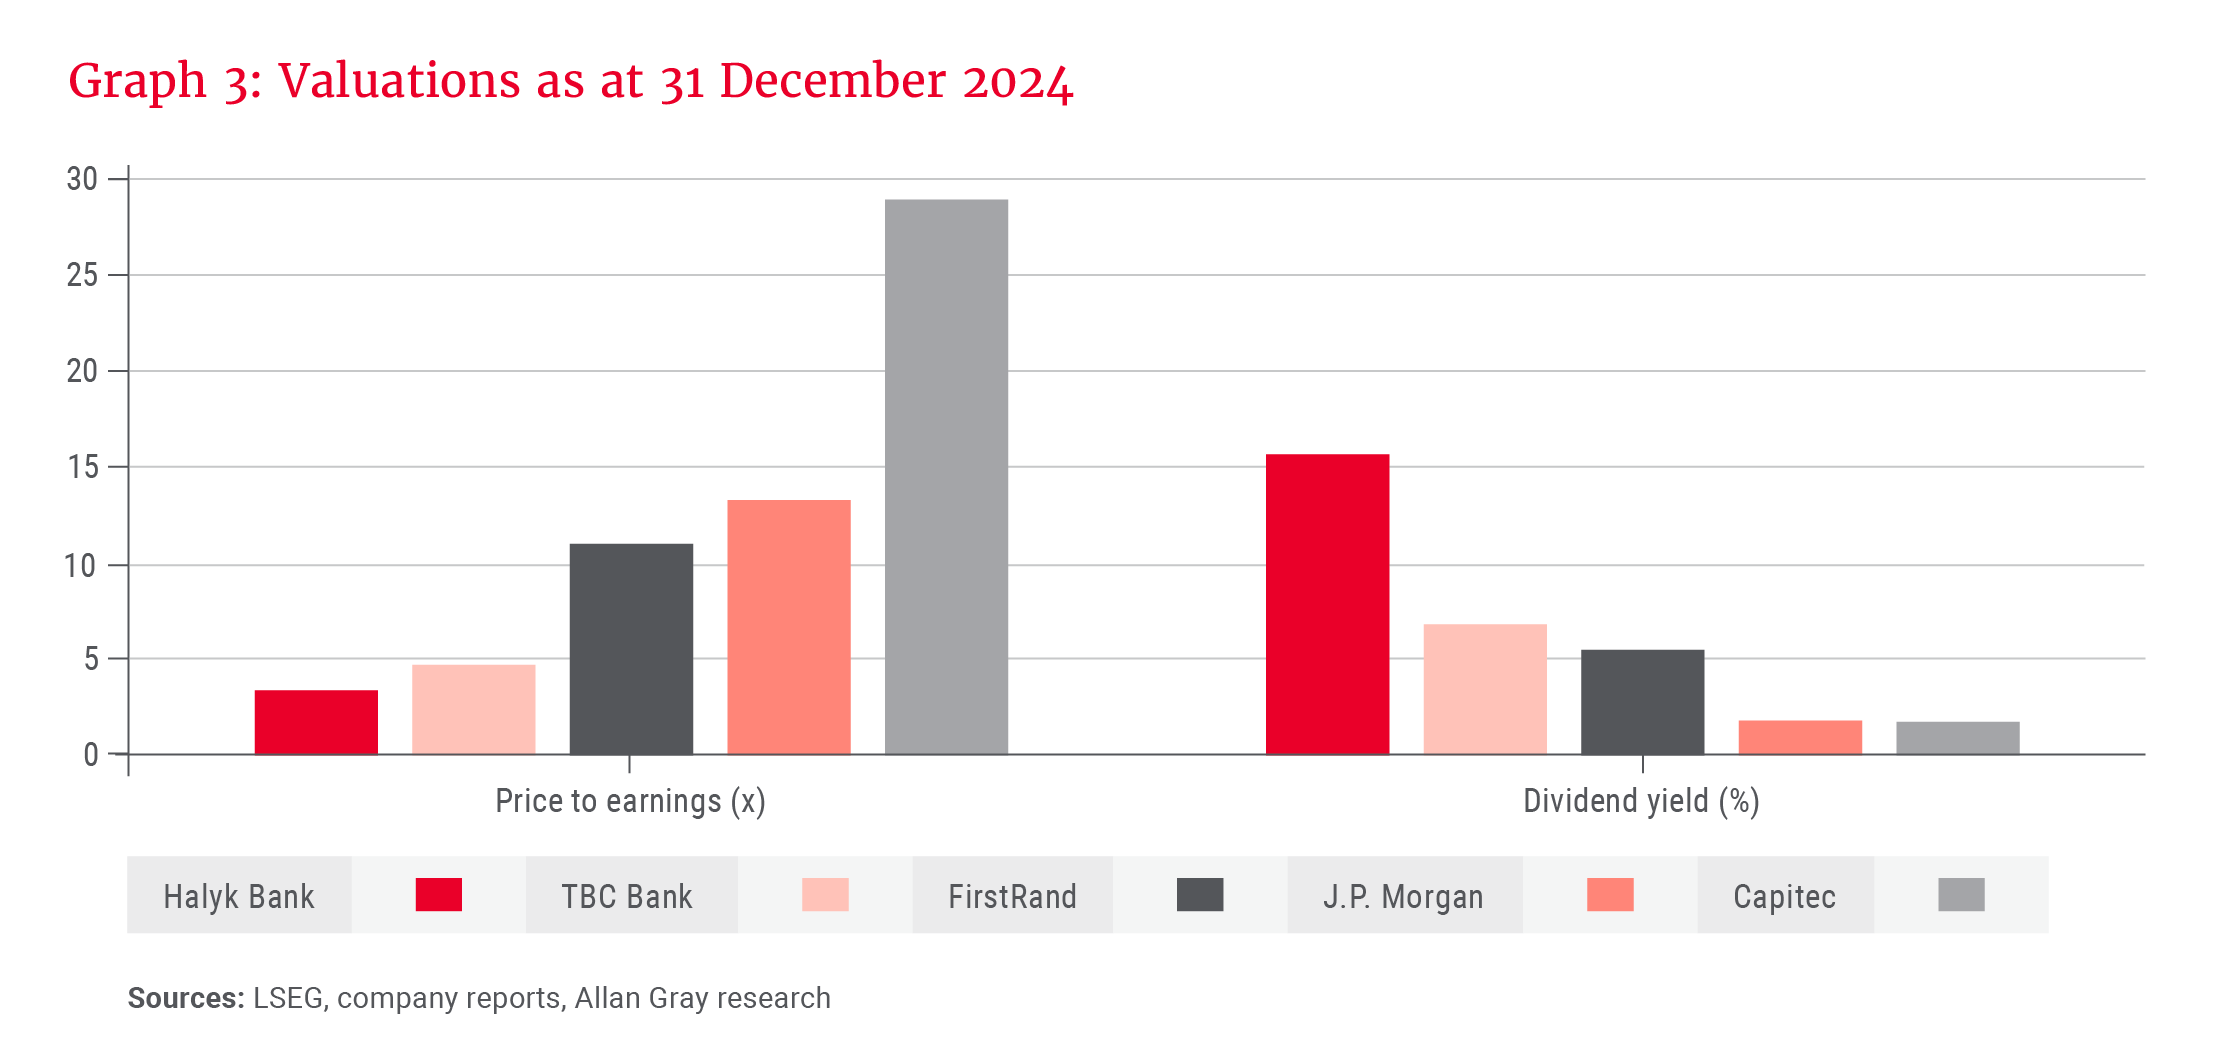
Graph 3 shows the price-to-earnings (P/E) multiple and dividend yield (DY) the market placed on each of these banks at the end of December 2024. All else being equal, a lower P/E multiple and higher DY imply a cheaper price. At less than five times earnings, both Halyk and TBC trade at a more than 50% discount to J.P. Morgan and FirstRand, and a greater than 80% discount to Capitec, despite having superior historic earnings growth.
How is this possible?
1. Markets are forward-looking, so it is possible that markets are discounting a dire future for Halyk and TBC and a particularly rosy future for Capitec, and/or:
2. Markets reflect current sentiment, i.e. ignorance or prejudice.
On our analysis, we believe the valuation disparity is overwhelmingly caused by the latter, where excessive pessimism, uncertainty and despondency are weighing heavily on shares in the former USSR blocks. Many of the companies in these markets were already overlooked and out of favour before Russia invaded Ukraine; the war has only exacerbated that negative sentiment. Although sentiment has improved somewhat from the bottom in mid-2022, it remains depressed, with political activity continuing to have an outsized impact on sentiment in the short term, particularly in Georgia.
Looking through the geopolitical noise, however, you find two high-quality companies trading at very attractive prices. We have already highlighted the historic earnings growth of each company, but perhaps more importantly, they continue to have a long runway for growth ahead of them, with banking penetration in both markets materially lagging that of larger emerging and developed market peers.
You want to fish where there are plenty of fish, but no other fishermen. Frontier markets might just be such an opportunity.
The underlying economies have also been growing strongly. In addition to that, both banks are well capitalised, have excellent digital offerings, world-leading cost-to-income ratios, and returns on equity consistently over 20%.
The experience during the COVID-19 pandemic provides an apt example of each bank’s abilities to weather hardships. Perhaps more surprising is that the banking sectors in both Kazakhstan and Georgia have been indirect beneficiaries of the war, with a large portion of regional trade being redirected through their markets, boosting banking activity and the economy.
Given that both banks continue to pay healthy dividends, grow earnings and have recently begun share buybacks, we believe the patient investor is well poised to generate good dollar returns from today’s starting prices, even if their valuations stay depressed. In fact, despite their low valuations today, they both have already been good investments. You don’t need a rerating for that to continue. Halyk has delivered a US dollar total return of 23% p.a. over the past five years and 19% p.a. over the past 10 years. TBC has returned 24% p.a. in US dollars over the past five years and 15% p.a. over the past eight years (TBC only listed in 2016).
Can something go wrong that would disrupt the current investment case?
Of course. It is inevitable that we will make mistakes – both at a company and country level. Indeed, we already have.
This is, however, just one example of the opportunities we can find across the frontier universe. Across sectors and geographies, we can find a number of other companies that trade at substantial, unjustified discounts to their developed market peers.
We mitigate the risk of a single investment by managing position sizes, and deliberately investing across geographies and sectors, which allows us to minimise company-, sector- and country-specific risks. If we can find a number of uncorrelated opportunities that have significant upside as a result of mispriced risk, the investments that generate outsized returns should materially outweigh those that disappoint.
If the investable universe were an ocean, think of the United States as the most popular fishing location, renowned for big fish. For the past decade, fishermen have consistently returned home with above-average catch rates. Today, however, it is awash with competing fishermen. As a result, only the most skilled angler is able to consistently bring home an above-average catch. Most fishermen now risk returning home with a below-average catch.
In contrast, frontier markets represent remote pockets of the ocean, with volatile and unfamiliar seas, but far from devoid of marine life. Fishing here can be lonely, but it can also be extremely rewarding.
You want to fish where there are plenty of fish, but no other fishermen. Frontier markets might just be such an opportunity.
The distinction between developed, emerging and frontier markets is primarily based on the stage of economic and market development, growth potential, liquidity, market accessibility and associated risks. It is somewhat subjective.
Developed markets are countries with high levels of income, stable economies, and well-established financial markets. Examples include the US, UK, Japan, Germany, Canada and Australia.
Emerging markets are economies that are in the process of rapid growth and industrialisation, but that have not yet reached the level of developed markets. Examples include China, India, Brazil, South Africa, Mexico, Russia and Indonesia.
Frontier markets are economies that are less developed than emerging markets. They are often smaller, less liquid, and may be at earlier stages of economic development. They are generally perceived as the highest risk. Examples include Vietnam, Georgia, Kenya, Nigeria, Bangladesh, Morocco and Pakistan.
Explore more insights from our Q4 2024 Quarterly Commentary:
- 2024 Q4 Comments from the Chief Operating Officer by Mahesh Cooper
- Paying tribute to Gillian Gray by Craig Bodenstab
- Diamonds in the rough: A look at luxury by Jithen Pillay
- Orbis: President’s letter 2024 by Adam R. Karr
- In safe hands with the Allan Gray Balanced Fund by Nick Curtin
- How to maximise tax benefits in a two-pot era by Carla Rossouw and Lee Kotze
- How to keep the lid on lifestyle creep by Twanji Kalula
To view our latest Quarterly Commentary or browse previous editions, click here.